Surf forecast
A surf forecast for your spot, not your region
Most forecasts hand you one swell height for a whole stretch of coast. The same five feet of south swell can be head high at one break and knee high at its neighbour. Beachable stores the geometry of 112 surf spots and solves the swell onto each one.


How it works
From offshore spectrum to breaking face
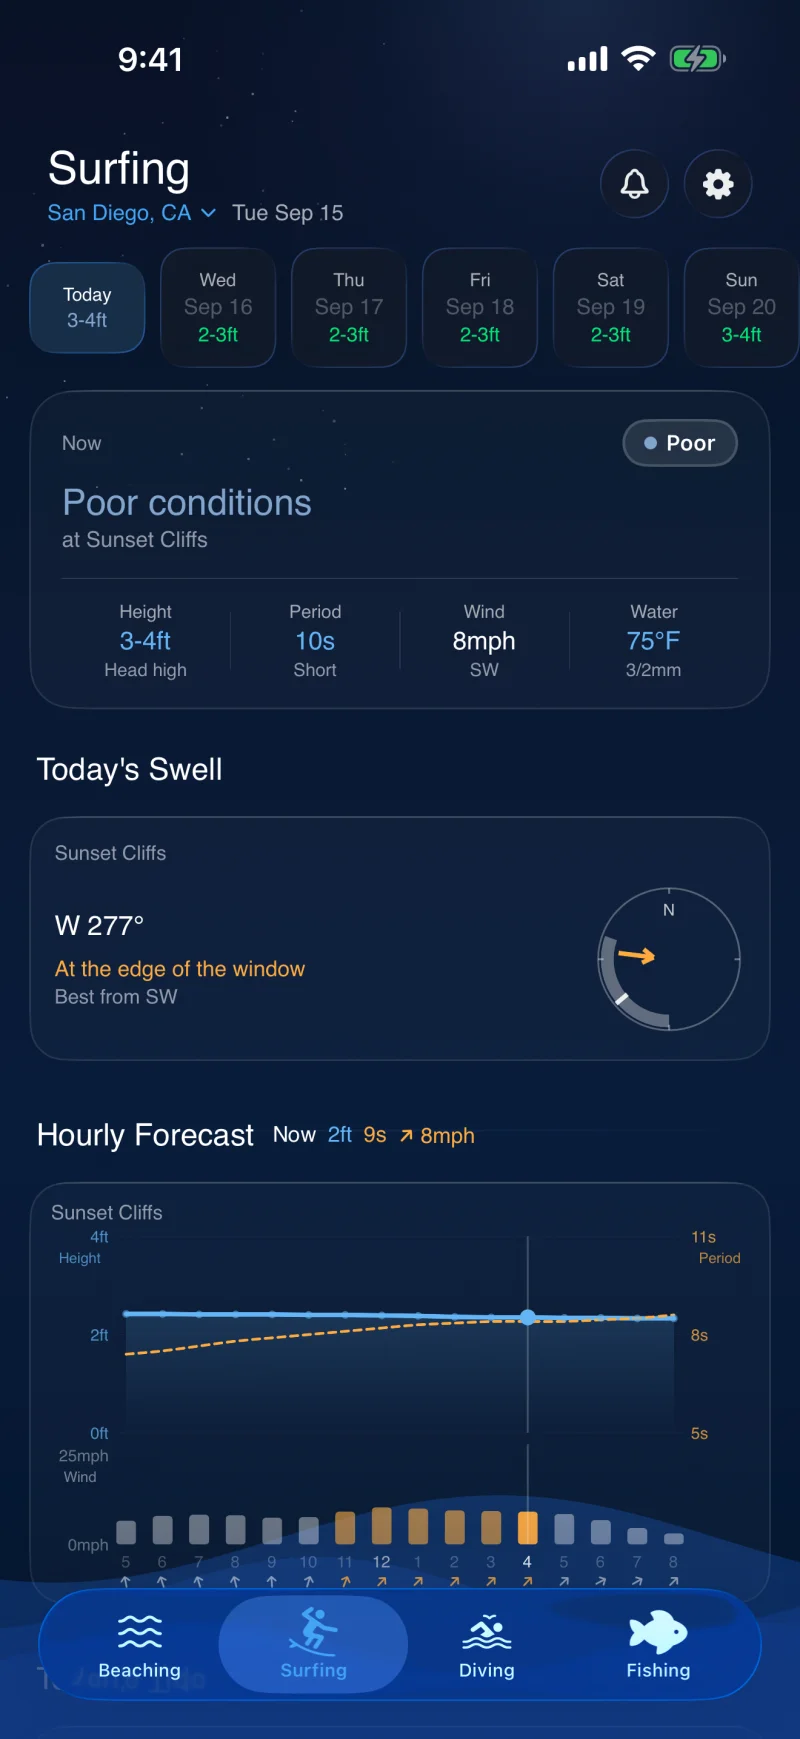
Every spot stores the arc of swell directions that physically reach it, the direction it faces, how much open ocean energy survives the trip, the wind direction that grooms it and the size range it actually holds.
Only the swell that arrives counts
Each spot has a swell window. Energy outside that arc is shadowed by an island, a headland or the shape of the coast, so it is not counted against the spot. A sheltered break in a big swell reads small, because it is small.
Height is a face, not a buoy reading
Offshore significant wave height and the face you drop into are different quantities. The swell is refracted onto the spot's own orientation, converted to a breaker height using the wave period, and capped at the size that spot is known to hold. Spots close out, they do not keep growing.
A research model where one exists
Along the California coast, Scripps publishes a nearshore model resolved to roughly every hundred metres of shoreline. Where it covers a spot, Beachable reads it directly instead of estimating, because a published model beats anything reconstructed from an offshore spectrum.
Hour by hour, first light to last
The hourly chart runs the whole usable day rather than the hours the sun is technically up, since surfers are out before the sun clears the horizon. Height, period and wind are plotted together so you can pick a window rather than read a table.
The data
What it reads
Established, peer-reviewed sources, read live rather than reprocessed. Breaking face heights are derived from these, not republished from them.
NOAA buoys
The NDBC network for observed height, period and direction, with a staleness check so a buoy that has gone quiet stops being treated as current.
CDIP nearshore models
Scripps' Monitoring and Prediction system, which runs a spectral refraction model onto the California coast.
Open-Meteo marine
Swell partitions and the wave spectrum wherever buoys do not reach, plus the peak period model the forecast uses.
Wind
Hourly wind speed and direction, judged against the direction that actually grooms each spot rather than a single offshore rule.
Tide harmonics
Each spot stores the tide stage it prefers, which is read from the same predicted curve the beaching tab uses.
Spot profiles
Swell window, facing direction, exposure, ideal period band and rideable size range, researched by hand for each spot.
Questions
Common questions
The answers below are also what the structured data on this page reports, so a search result cannot say something the page does not.
How is this different from a normal surf forecast?
A regional forecast reports the swell offshore. Beachable reports what that swell becomes at a named break, by admitting only the directions that reach it, refracting them onto the direction it faces and converting the result to a breaking face height capped at the size the spot holds.
How accurate is it?
Where a published nearshore model covers the coast, Beachable reads that model rather than estimating. Elsewhere the estimate is graded against those models spot by spot, and the measure used is whether two spots come out ranked in the wrong order, since a uniform offset is invisible to a surfer but a wrong ranking is not.
Can I add a spot that is not listed?
Yes. Added spots are forecast with an open coast beach break estimate rather than a researched profile, so they read larger at a sheltered break. The 112 seeded spots carry hand-researched geometry.
What is free and what is Pro?
Today's conditions, every spot and the go or no-go verdict are free with no account. Pro is 24.99 US dollars a year and adds the ten-day forecast, custom swell alerts, the detailed spot match breakdown and wetsuit recommendations.
The rest of the app
One app, four activities
Every activity is scored through its own physics rather than one shared number, and they all read the same live ocean data.
Beach tides
The hours a specific beach is walkable, from its own tide threshold rather than the tide table.
Dive visibility
Visibility scored from each site's own clarity curve, its shelter from swell and satellite water colour.
Fishing forecast
Inshore and offshore judged on different physics, with the species actually in season.

Check the coast before you go.
Free on iOS and Android. Upgrade to Pro whenever you want the extended forecast and alerts.