Fishing forecast
Fishing conditions, inshore and offshore
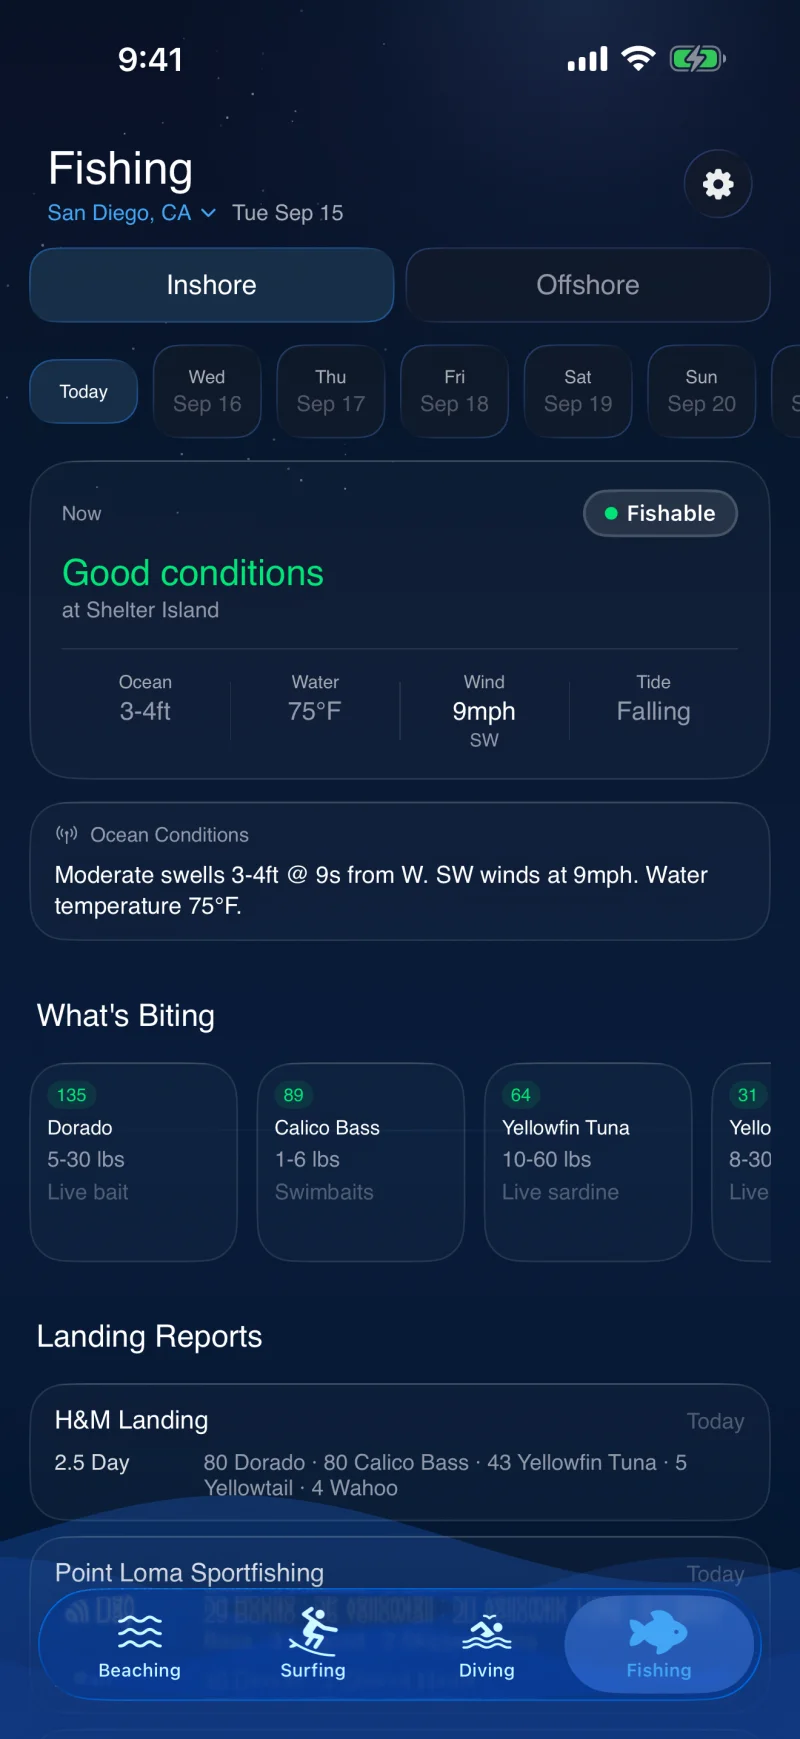
A jetty and a bank forty miles offshore are not the same fishery, so they should not be scored by the same rule. Beachable runs two different models, weights them differently, and will tell you outright when the sea is too big for the run.


How it works
Two fisheries, two sets of physics
Tidal movement largely stops mattering twenty miles out, and the moon's real mechanism is the tidal range it drives. So the offshore model does not use the moon at all, and the inshore model is carried by the tide.
Inshore runs on the tide
Moving water is the strongest signal close in, and the incoming is separated from the outgoing rather than flattened into one value. The moon contributes a little, through the spring and neap range it produces, and nothing more.
Offshore runs on sea state and temperature breaks
What decides an offshore day is whether you can get out there and whether you can find the edge. Sea state and the local thermal front carry most of the score, tide barely registers, and the moon is weighted at zero.
Sea state can veto the day
Every spot stores the sea it is fishable in, and above that the verdict is a no regardless of how good everything else looks. This is the safety-relevant part: a model without it will happily recommend a forty mile run into ten foot seas.
Temperature is judged against the fishery
Eighty degrees is a great day in the tropics and a bite-killing anomaly off southern California, so water temperature is scored against a band set by latitude and by the species actually in season, rather than against one global ideal.
The data
What it reads
Six live feeds plus a researched profile per spot, covering 92 fishing spots.
Satellite sea surface temperature
NOAA CoastWatch's blended product, used offshore for the point temperature and, more importantly, the local thermal gradient that marks a break.
Sea state
Buoy and model wave height, checked against the sea each spot is actually fishable in.
Tide harmonics
Stage and direction from the predicted curve, weighted heavily inshore and lightly offshore.
Wind
Speed and direction against a ceiling that differs between inshore and offshore water.
Barometric trend
Three hour pressure change, weighted as the weak signal the literature actually supports rather than as a headline.
Landing reports
Around San Diego, dock counts from the sportfishing landings, applied only where they are geographically relevant.
Questions
Common questions
The answers below are also what the structured data on this page reports, so a search result cannot say something the page does not.
Why are inshore and offshore scored differently?
Because different things govern them. Tidal influence largely dies beyond fifteen to twenty miles, so scoring a bank on tide movement hands it points for nothing. Offshore, sea state and the thermal front do the work. The app shows a toggle when you have spots of both kinds and scores each on its own weighting.
Does it use the moon phase?
Inshore, a little. The moon's real mechanism is the tidal range it produces, which is a tide effect, so it contributes modestly to an inshore score. Offshore it is not used at all, and the app says so rather than showing an empty rating.
Does it know what is biting?
Each spot carries a species calendar written for that region, so the app names the species in season and says outright when a spot is off season. Around San Diego it also reads live dock counts from the landings.
What does it cost?
Today's conditions, every spot and the verdict are free with no account. Pro is 24.99 US dollars a year and adds the ten-day forecast, the detailed score breakdown and the daily best-activity digest.
The rest of the app
One app, four activities
Every activity is scored through its own physics rather than one shared number, and they all read the same live ocean data.
Beach tides
The hours a specific beach is walkable, from its own tide threshold rather than the tide table.
Surf forecast
Swell refracted onto the spot you are actually looking at, as a breaking face height.
Dive visibility
Visibility scored from each site's own clarity curve, its shelter from swell and satellite water colour.
Check the coast before you go.
Free on iOS and Android. Upgrade to Pro whenever you want the extended forecast and alerts.