Free on iOS and Android
Know before
you go.
Real-time tide, swell and ocean conditions for beaching, surfing, diving and fishing, scored spot by spot. One app for any coast in the world.


What it covers
Built for every coastal activity
Each tab reads live ocean data and scores conditions for that activity through the Fathom model, so you get a clear answer before you leave the house.
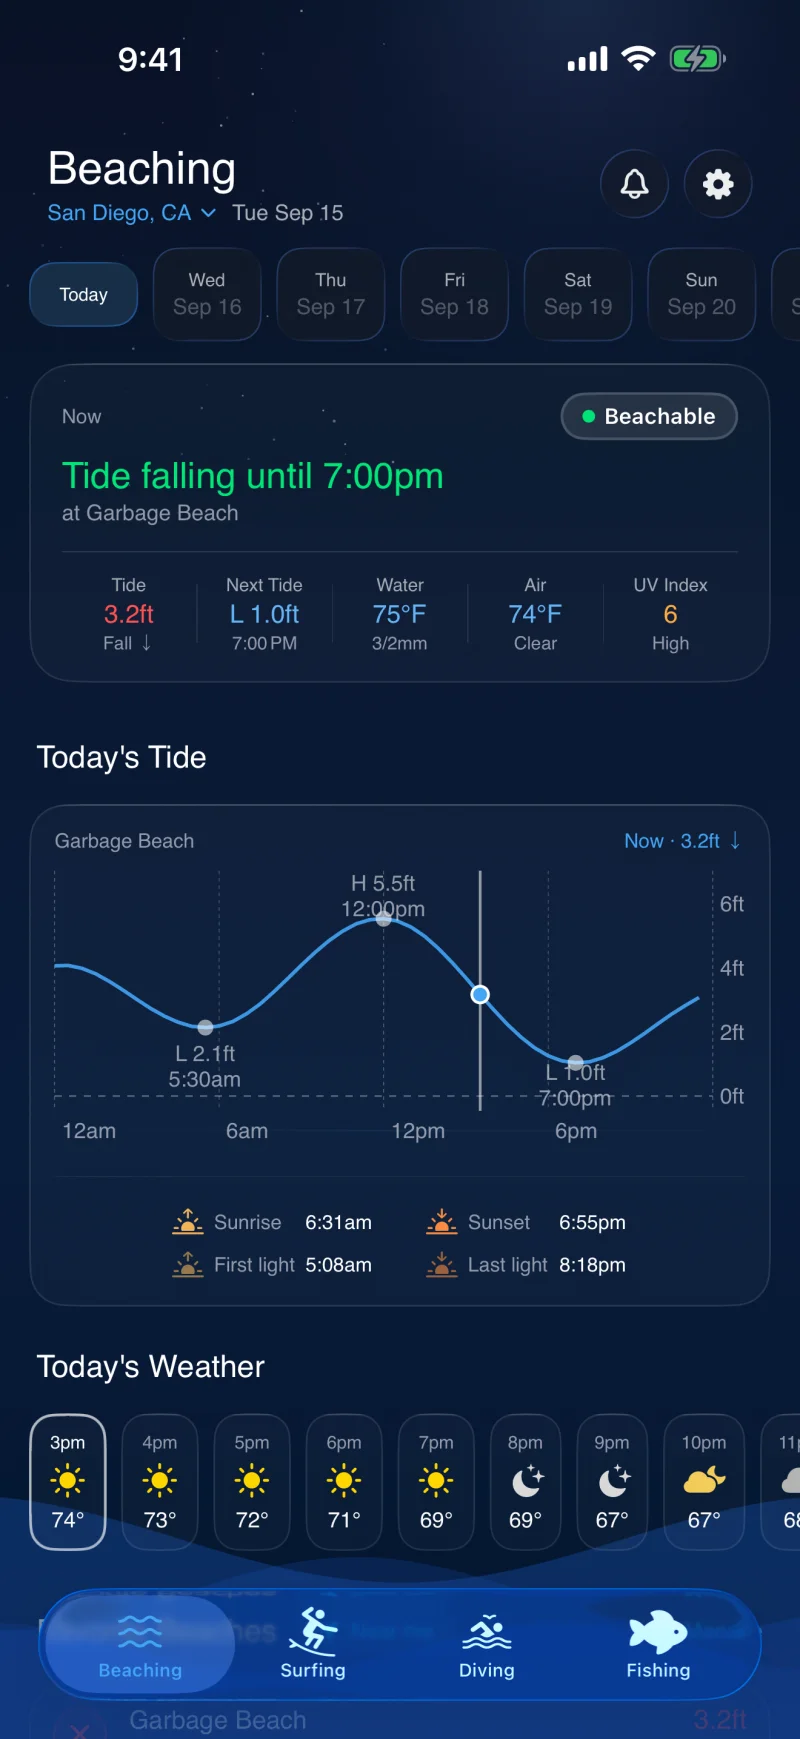
Beaching
A go or no-go verdict with tide windows, water temperature, and the hours the sand is actually there.
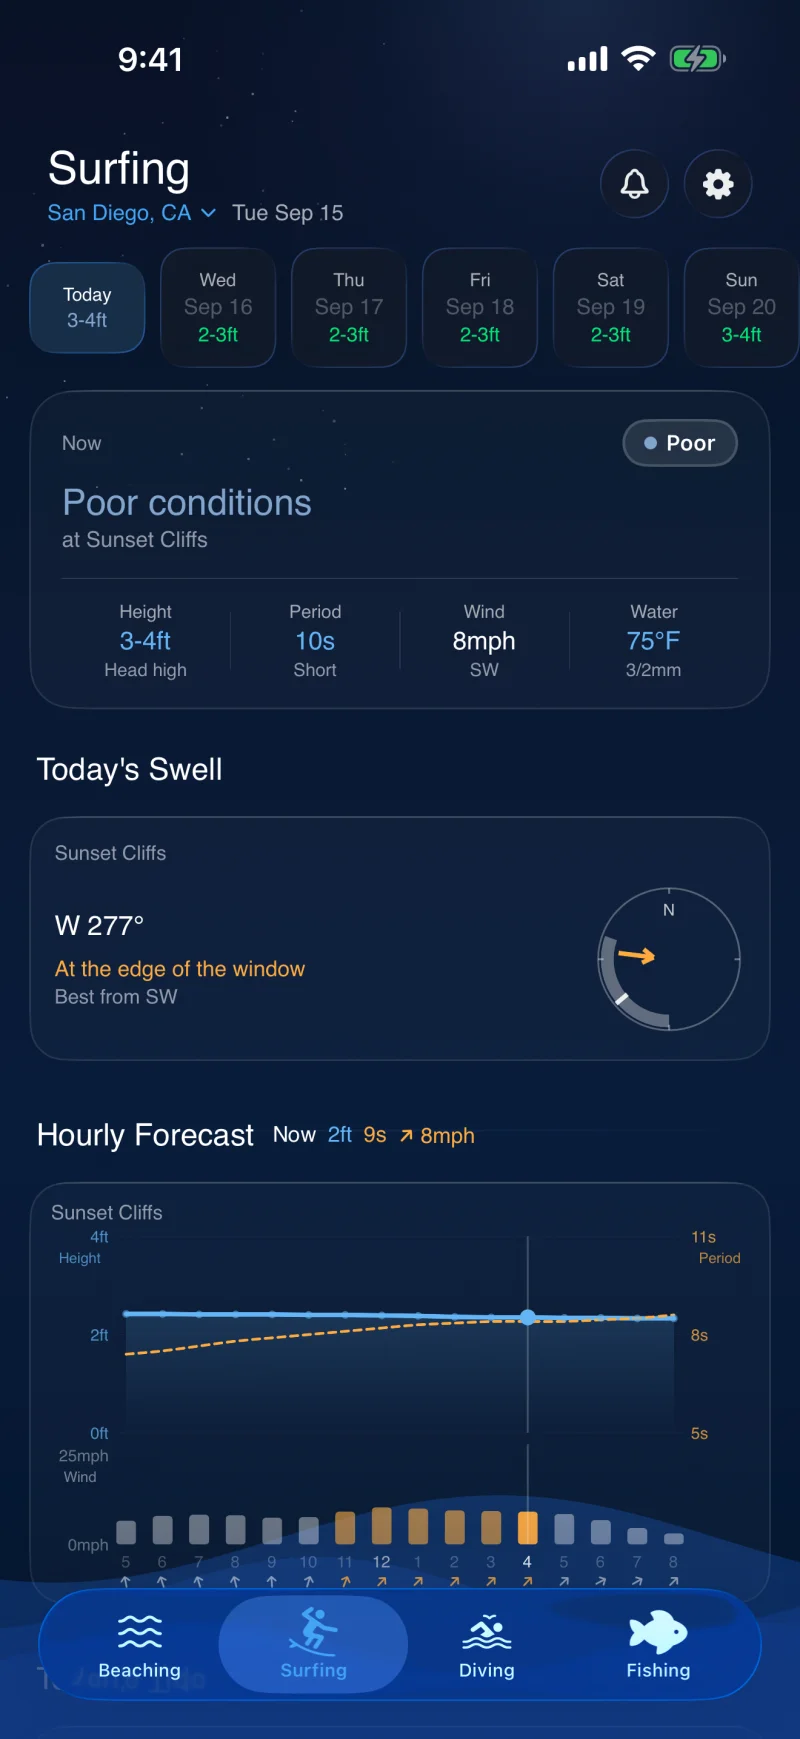
Surfing
Swell height, period, direction and wind, refracted onto the spot you are looking at. Read any hour from first light to last light. Ten-day forecast on Pro.
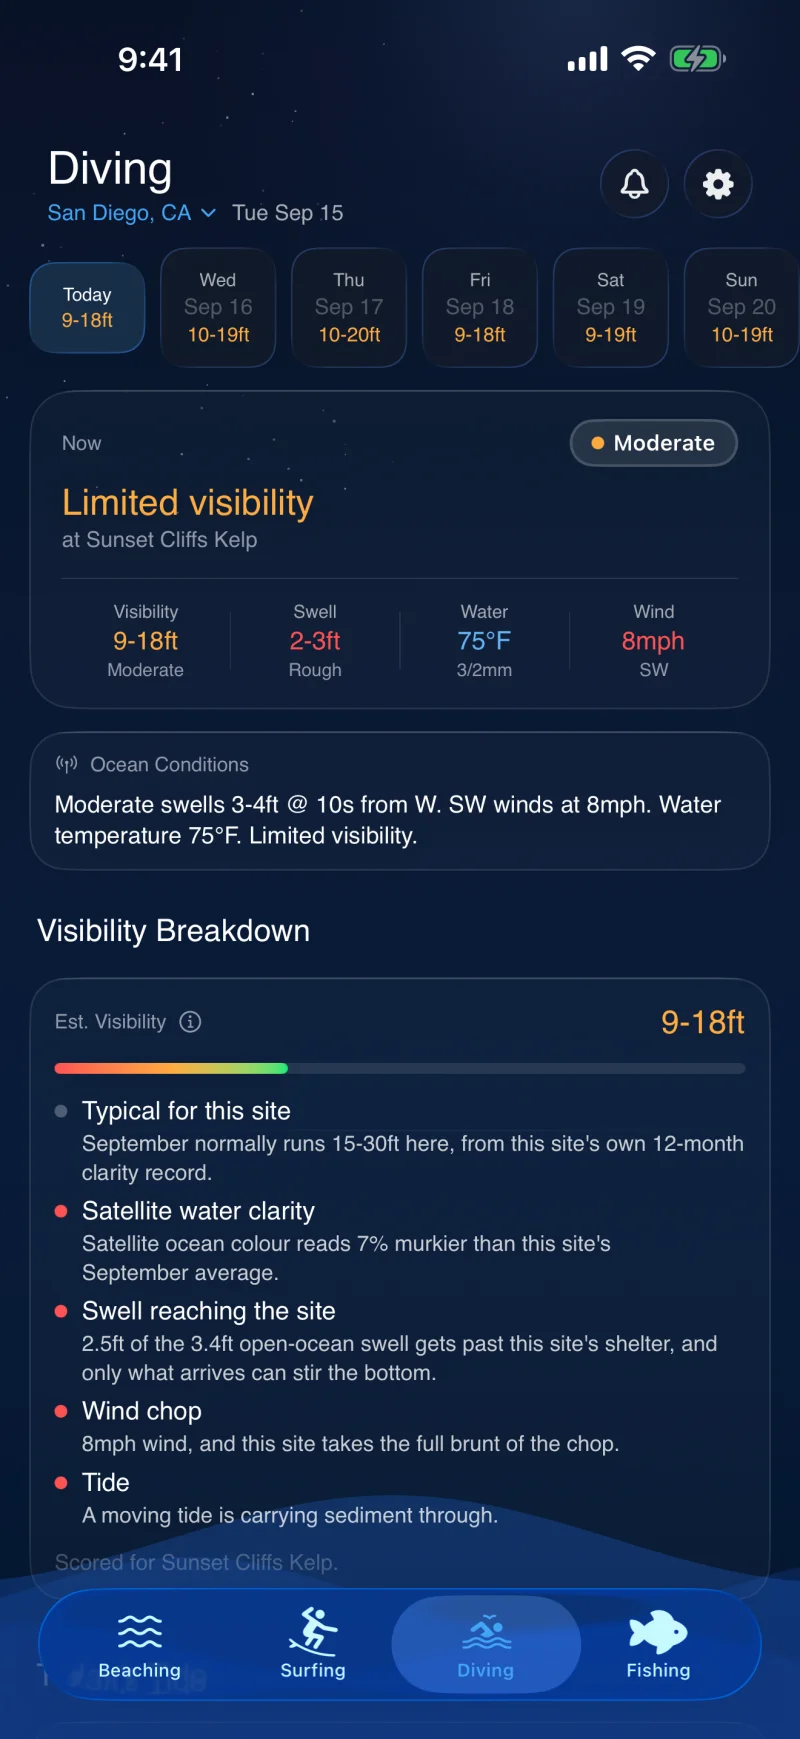
Diving
Visibility scored from each site’s own seasonal clarity curve, its shelter from swell, and satellite water clarity.
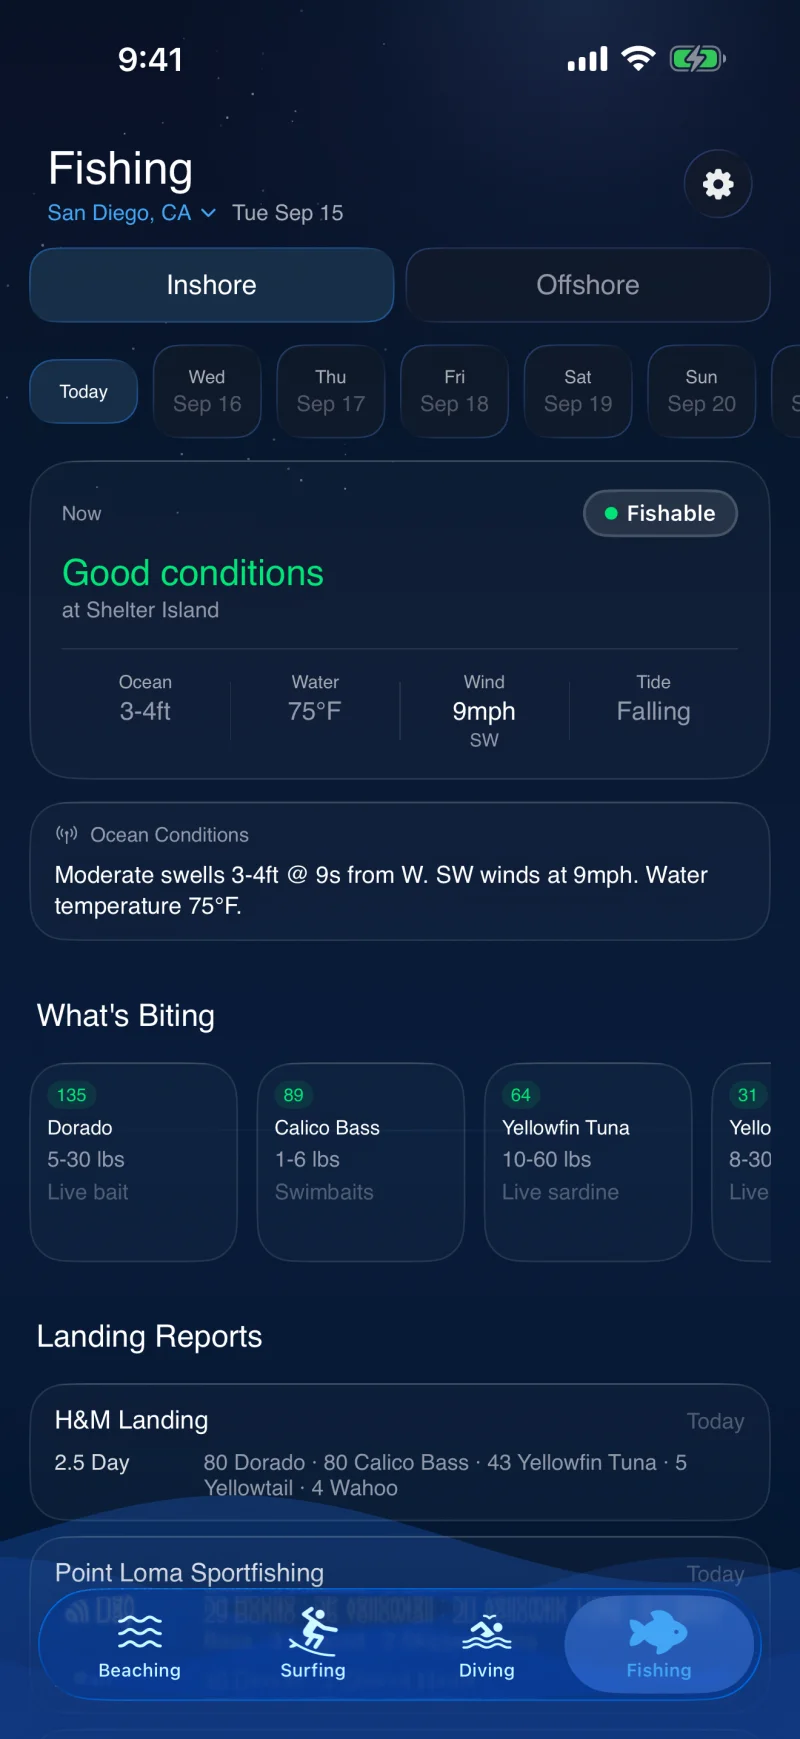
Fishing
Inshore and offshore judged on their own terms, with the species in season, water colour, and, around San Diego, live landing reports.
The conditions model
Fathom
Most apps hand you one number for a whole stretch of coast. Two spots a mile apart are rarely alike: one sits in the lee and stays glassy while the other is blown out. Fathom scores every spot through its own researched profile and the ocean physics that actually reach it.
Right now, one mile apart
Both readings come from the same offshore swell, scored through each spot's own profile. Live from the app's own backend.
Waves solved at the spot, not the region
Offshore swell is not what you paddle out into. Every surf spot stores the arc of swell directions that physically reach it, the direction it faces, and how much open-ocean energy survives the trip. Fathom refracts the offshore spectrum onto that geometry, then converts it to a breaking face using the spot’s own bottom and rideable range.
Shelter is physics, not a fudge factor
A swell that cannot reach a spot should not count against it. Fathom admits only the energy that actually arrives, so a sheltered site in a big swell reads calm, because it is calm. The same maths drives the dive verdict, which is why protected sites stop reporting poor visibility every time the open ocean gets up.
Local seasons on every coast
Each dive site carries a twelve-month clarity curve and each fishing spot its own species calendar, written for where it actually is. Tropical reefs follow the wet and dry seasons. Temperate coasts follow plankton, not temperature. Southern-hemisphere sites run on southern-hemisphere time. No global season curve is imposed anywhere.
Satellites see what wave models cannot
Fathom reads satellite ocean colour for water clarity, sea-surface temperature for the thermal fronts that concentrate offshore fish, and recent rainfall for runoff. Those catch the algal bloom, the river plume and the temperature break that no swell forecast will ever show you.
Measure
Buoy networks, public nearshore wave models, satellite ocean colour and sea-surface temperature, tide harmonics and atmospheric reanalysis. Established, peer-reviewed science, read live rather than reprocessed.
Transform
Global data becomes local through the spot’s own profile. Where a public nearshore model already resolves a coastline, Fathom reads it directly instead of guessing. Satellite clarity is compared against each site’s own baseline rather than read as an absolute, because the raw retrieval is unreliable over shallow, bright reef.
Decide
Each activity gets the physics that governs it. Tide stage carries an inshore fishing spot. Sea state and thermal fronts carry an offshore bank. A verdict that always says go is worth nothing, so sea state can veto a trip outright, and an out-of-season spot says so.
We grade Fathom against the published science
A per-spot model can be confidently wrong and never tell you. So we score ours spot by spot against research-grade nearshore wave models, and we measure the error people actually notice: whether two spots get ranked in the wrong order. That test is how we caught a spot reading bigger than one that always beats it, and it is what keeps the model honest. Where a public nearshore model already covers a coastline, we read it directly rather than guess.
Nearshore wave model data courtesy of CDIP, the Coastal Data Information Program at Scripps Institution of Oceanography, UC San Diego, supported by the U.S. Army Corps of Engineers. Breaking wave heights shown in Beachable are derived by Fathom and are not CDIP products.
Fathom reads
NOAA buoys · NOAA CoastWatch satellite data (VIIRS & Sentinel-3 OLCI) · CDIP nearshore models · WorldTides · Open-Meteo
The app
The verdict first, the numbers underneath
A dark interface that leads with the answer, then shows you the data it came from.
Pricing
Free to start. Pro when you’re ready.
Every spot, today’s full conditions and the go or no-go verdict are free, with no account required.
Free
$0
Everything you need for today.
- Real-time conditions for all four activities
- Go or no-go verdict for any beach
- Every spot and beach
- Current tide, wave and wind data
- Today’s full forecast
Beachable Pro
Pro$24.99
/ yearFor regular ocean-goers. Family Sharing included.
- Ten-day extended swell forecast
- Home screen widget, up to six spots (iOS)
- Daily best-activity digest
- Custom swell and visibility alerts
- Beach window notifications
- Detailed conditions breakdown
- Wetsuit and gear recommendations
Check the coast before you go.
Free on iOS and Android. Upgrade to Pro whenever you want the extended forecast and alerts.